OpenTelemetry Instrumentation
I always wanted to learn more on OpenTelemetry, and the best way to learn it is to try. So on a fine Friday morning, I started adding instrumentation code in one of my Projects that-ecs-manager. It is a Go backend with Svelte and Tailwind CSS frontend application.
Disclaimer: This is something that I am still learning, so code snippets shown here might not be something that one can use in production environment directly.
I knew some part of it like how OpenTelemetry can be setup using their clients, so I started exploring it. But then realized to see the Traces and Spans I need something like a visualization tool, like Jaegar/Zipkin or something that accepts the data and shows what’s happening.
Setting it up might have taken a long time, so I just used a service called Uptrace. It had good documentation and their distro was open-sourced so I thought let’s give it a try.
In some cases getting metrics out of the application are easy if you’ve used standard library packages, like net/http or database/sql, and that’s what helped me do this quickly in span of 2-3 hours.
Instrumentation
I started with reading the OTel documentation and got my project for managing ECS ready as well, it had few endpoints like GET /api/v1/services and POST /api/v1/service. So basically I need some observability in terms of which APIs are called and what happens inside it. For APIs I have net/http and for AWS it is aws-sdk-go-v2.
Uptrace
Before instrumenting anything we need to make sure the traces are going to be pushed somewhere, there are providers like AWS X-Ray, but I went with Uptrace. Inside main() function we add these lines that start the OTel part and send details to Uptrace project.1
ctx := context.Background()

// Configure OpenTelemetry with sensible defaults.
uptrace.ConfigureOpentelemetry(
    // copy your project DSN here or use UPTRACE_DSN env var
    // uptrace.WithDSN("https://<key>@api.uptrace.dev/<project_id>"),

    uptrace.WithServiceName("myservice"),
    uptrace.WithServiceVersion("1.0.0"),
)
// Send buffered spans and free resources.
defer uptrace.Shutdown(ctx)
HTTP
Extracting metrics and labels from net/http package is simple, I was using s.mux.HandleFunc("/api/v1/services", s.handleServices()) where mux is a struct level *http.ServeMux and to start it we use http.ListenAndServe(":8001", addr).
To extract metrics out OpenTelemetry has a package otelhttp (go.opentelemetry.io/contrib/instrumentation/net/http/otelhttp) it has a function NewHandler() that acts as a middleware and wraps the handler in a span named after the operation. That makes the change as follows.
// before
s.mux.HandleFunc("/api/v1/services", s.handleServices())

// after
s.mux.Handle("/api/v1/services", otelhttp.NewHandler(otelhttp.WithRouteTag("/api/v1/services", http.HandlerFunc(s.handleServices())), "services-handler"))
To make it generic, I created a function that wraps all that in one go.
func (s *Server) addRouteAndInstrumentHandler(route, name string, h http.HandlerFunc) {
    s.mux.Handle(route, otelhttp.NewHandler(otelhttp.WithRouteTag(route, http.HandlerFunc(h)), name))
}
And that makes the routes part be easy like and more readable.
// before
s.mux.HandleFunc("/api/v1/services", s.handleServices())

// after
s.addRouteAndInstrumentHandler("/api/v1/services", "services-handler", s.handleServices())
AWS
I tried a lot of different things to see how this could have worked, couldn’t find a lot but the contrib repository has all the integrations we may need. Fortunately it also has AWS in otelaws2 with examples.
Naturally I just used it, and saw how it would work.
Spoiler Alert: It was damn simple!
To initialize an AWS ECS client, or any other AWS client, we need github.com/aws/aws-sdk-go-v2/config.Config which can be created as follows.
cfg, err := config.LoadDefaultConfig(ctx,
    config.WithRegion(region),
    config.WithSharedConfigProfile(profile))

if err != nil {
    log.Fatal(err)
}
This cfg also allows adding some middlewares to the API calls, that’s where otelaws is used and sets another middleware.
cfg, err := config.LoadDefaultConfig(ctx,
config.WithRegion(region),
config.WithSharedConfigProfile(profile))
if err != nil {
log.Fatal(err)
}
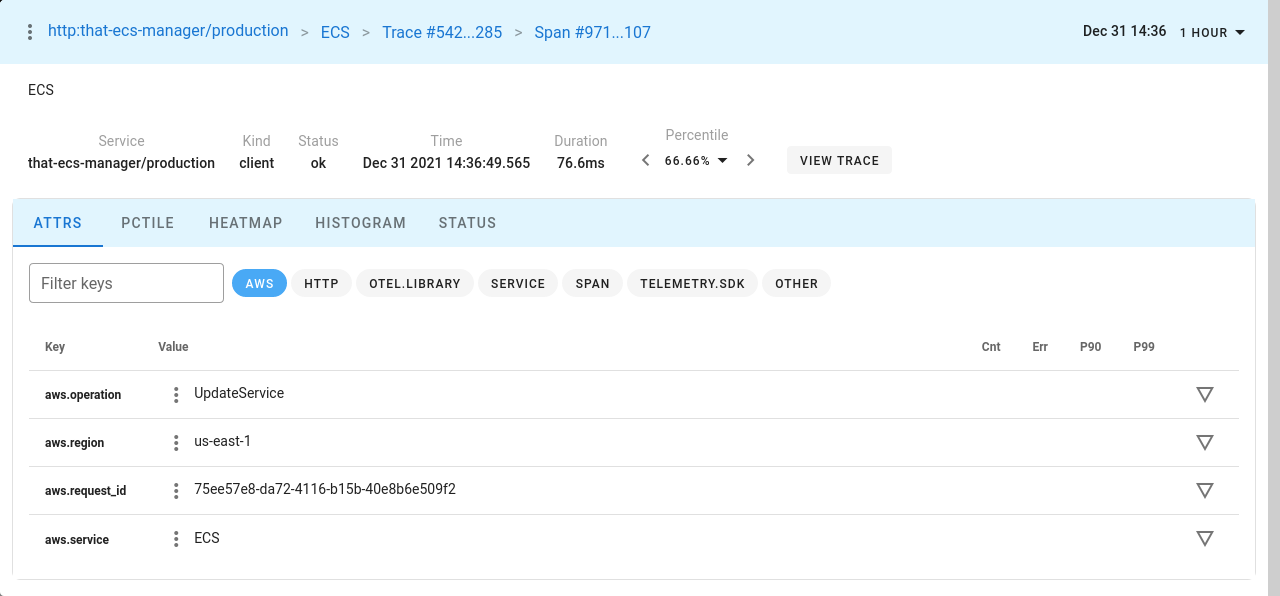
otelaws.AppendMiddlewares(&cfg.APIOptions)
And done. AWS Client is instrumented and will emit spans whenever AWS Client API is called, in this case this config was used for AWS ECS Client so all ECS functions.
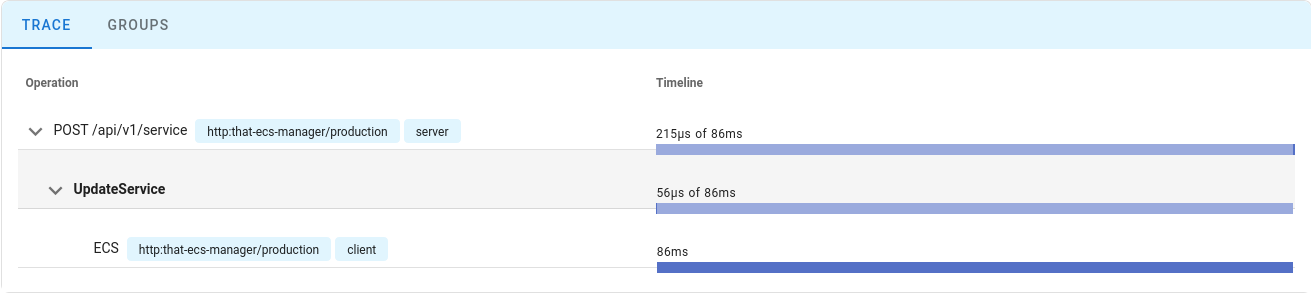
But there’s a catch, I got most of the things, starting from HTTP API to AWS but in between if there was a need to know which attributes were passed on to ECS API I didn’t have visibility there.
As seen from the screenshot there’s nothing that shows which service was updated or what cluster it was updated for, so to add more details we can instrument the functions that call this API.
Functions
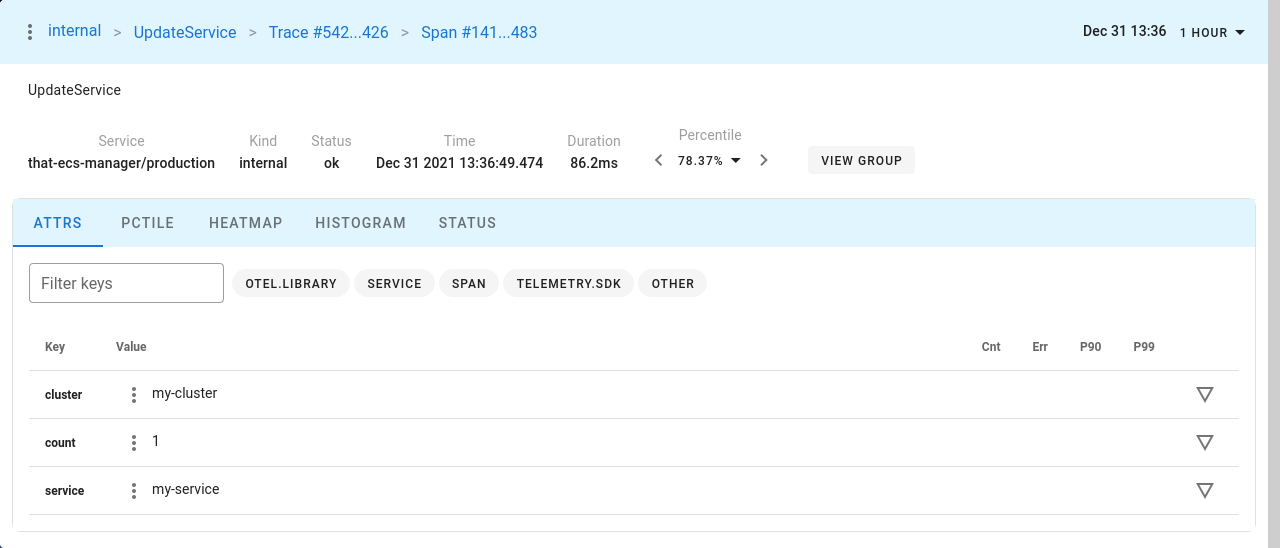
I have to explore more on this, but there was basic working span that I was able to add using just the following additional lines.
func (e *ECS) UpdateService(ctx context.Context, cluster, service string, count int) error {

    // additional lines for adding a span
    ctx, span := e.tracer.Start(ctx, "UpdateService")
	defer span.End()
	span.SetAttributes(
		attribute.String("cluster", cluster),
		attribute.Int("count", count),
		attribute.String("service", service),
	)

    // additional lines end

	// log.Printf("in UpdateService(%s, %s, %d)\n", cluster, service, count)
	_, err := e.client.UpdateService(ctx, &ecs.UpdateServiceInput{
		Service:      &service,
		Cluster:      &cluster,
		DesiredCount: aws.Int32(int32(count)),
	})
	if err != nil {
		return err
	}
	return nil
}
By doing that we can get extra details inside span as attributes and it also shows if there is any latency added due to some internal workings.